Market Outlook
August 07, 2017
Market Cues
Domestic Indices
Chg (%)
(Pts)
(Close)
Indian markets are likely to open flat tracking global indices and SGX Nifty.
BSE Sensex
0.3
88
32,325
U.S. markets continue their upward move reaching new highs. Better than expected
Nifty
0.5
53
10,066
job data lifted the sentiment up and selected stocks witnessed buying during the day.
Mid Cap
0.7
102
15,437
While most economist had expected employment to climb up by 1,89,000 and the
Small Cap
0.1
15
15,927
actual outcome of 2, 09,000 jobs for July came in as a positive surprise for
Bankex
0.7
189
28,075
investors. The US $ also gained some strength post the favourable data.
The favourable job data and positive move in the Dowjones helped the European
Global Indices
Chg (%)
(Pts)
(Close)
market in opening positive. The German factory orders grew by 1% in June, as
compared to the expectations of 0.5% and this helped in negating some mixed
Dow Jones
0.3
67
22,093
corporate results.
Nasdaq
0.2
11
6,352
FTSE
0.5
37
7,512
Indian markets closed on modest gain on Friday, after two days of losing streak.
Nikkei
(0.4)
(77)
19,952
While the markets opened on a weak note, there buying interest at lower leaves and
this lifted the markets up. State run oil marketing companies witnessed strong buying
Hang Seng
0.1
32
27,563
interest, while healthcare companies were under selling pressure due to actions from
Shanghai Com
(0.3)
(11)
3,262
US FDA. With large part of the quarterly results behind now, Indian markets will look
forward for global cues for next move, which remain positive now.
Advances / Declines
BSE
NSE
News Analysis
Advances
1,189
831
Mahindra & Mahindra’s Q1FY18 PAT falls 20%
Declines
1,426
850
Unchanged
164
68
Detailed analysis is on Pg2
Investor’s Ready Reckoner
Volumes (` Cr)
Key Domestic & Global Indicators
BSE
3,836
Stock Watch: Latest investment recommendations on 150+ stocks
NSE
27,481
Refer Pg7 onwards
#Net Inflows (` Cr)
Net
Mtd
Ytd
Top Picks
CMP
Target
Upside
Company
Sector
Rating
FII
56
(296)
58,100
(`)
(`)
(%)
MFs
(25)
1,626
52,572
Blue Star
Capital Goods
Accumulate
675
760
12.6
Dewan Housing FinanceFinancials
Buy
457
550
20.4
Mahindra Lifespace
Real Estate
Buy
420
522
24.4
Top Gainers
Price (`)
Chg (%)
Navkar Corporation
Others
Buy
193
265
37.0
Unitech
8
9.9
KEI Industries
Capital Goods
Buy
224
258
15.3
More Top Picks on Pg5
Titan
610
9.5
Hindpetro
432
8.7
Key Upcoming Events
Ioc
418
8.0
Previous
Consensus
Date
Region
Event Description
Reading
Expectations
M&Mfin
423
7.2
Aug 08, 2017 China
Exports YoY%
11.30
11.00
Aug 09, 2017 China
Consumer Price Index (YoY)
1.50
1.50
Top Losers
Price (`)
Chg (%)
Aug 10, 2017 India
Imports YoY%
19.00
Hdil
76
(9.2)
Aug 10, 2017 US
Initial Jobless claims
240.00
240.00
Aug 10, 2017 India
Exports YoY%
4.40
Ceatltd
1,734
(8.8)
More Events on Pg7
Biocon
357
(4.8)
Mrf
66,395
(4.0)
Hcc
39
(3.8)
#as on 4rd Aug, 2017
Market Outlook
August 07, 2017
News Analysis
Mahindra & Mahindra’s Q1FY18 PAT falls 20%
Mahindra & Mahindra Ltd reported a lower than expected PAT at `765 cr, down
20% YoY, vs `961 cr. The company took a hit of Rs 144 cr during the quarter to
compensate its dealers ahead of GST. Overall sales grew by 3.2% YoY to `12,336
cr, backed by a strong 12% growth in farm equipment segment. However,
passenger vehicles sales slowed down ahead of transition to GST in July and the
segment reported a decline of 3.8% in its sales. The export markets also remained
under pressure during the quarter. A revival in rural demand and good monsoon
on the other hand had a positive impact on the tractor segment. Total tractor sales
during the quarter stood at 81,178 up 13%, while domestic passenger vehicle
sales declined by 6% YoY 55,785 units. The company has been facing stiff
competition from other passenger car companies off late and the management
says it has lost some market share in the UV segment. The UV sales were down 5%
YoY. While there could be revival in its volume with the introduction of new models
and variants, still overall growth could remain muted.
Economic and Political News
India’s forex reserves surges to record $ 392.86 billion
Income Tax department identifies 30,000 cases for scrutiny
SEBI tells listed companies to disclose loan defaults within one day
Corporate News
HPCL Q1FY18 net drops 56% at `925 cr on high inventory loss
ONGC buys 80% participating interest in GSPC block
Vedanta sells $1 billion bonds to refinance $1.8 billion debt
Arvind Ltd posts 22% fall in Q1FY18 PAT at `57 cr
NCLT to decide on RCom-Aircel merger on 10th August
IOC to acquire up to 50% in Mundra LNG terminal
Market Outlook
August 07, 2017
Quarterly Bloomberg Brokers Consensus Estimate
Tata Steel Ltd - Aug 7, 2017
Particulars (` cr)
1QFY18E
1QFY17
y-o-y (%)
4QFY17 q-o-q (%)
Net sales
28,408
25,156
12.9
33,424
(15.0)
EBITDA
4,252
3,242
31.2
7,025
(39.5)
EBITDA margin (%)
15.0
12.9
21.0
Net profit
1,256
(3,207)
0.0
(1,168)
0.0
Britannia - Aug 7, 2017
Particulars (` cr)
1QFY18E
1QFY17
y-o-y (%)
4QFY17 q-o-q (%)
Net sales
2,238
2,106
6.3
2,230
0.4
EBITDA
320
316
1.0
308
3.7
EBITDA margin (%)
14.3
15.0
13.8
Net profit
219
219
(0.2)
211
3.7
Market Outlook
August 07, 2017
Top Picks HHHHH
Market Cap
CMP
Target
Upside
Company
Rationale
(` Cr)
(`)
(`)
(%)
Strong growth in domestic business due to its leadership
in acute therapeutic segment. Alkem expects to launch
Alkem Laboratories
21,866
1,829
2,161
18.2
more products in USA, which bodes for its international
business.
We expect the company would report strong profitability
Asian Granito
1,275
424
480
13.2
owing to better product mix, higher B2C sales and
amalgamation synergy.
Favourable outlook for the AC industry to augur well for
Cooling products business which is out pacing the
Blue Star
6,465
675
760
12.6
market growth. EMPPAC division's profitability to improve
once operating environment turns around.
With a focus on the low and medium income (LMI)
consumer segment, the company has increased its
Dewan Housing Finance
14,320
457
550
20.4
presence in tier-II & III cities where the growth
opportunity is immense.
Loan growth is likely to pick up after a sluggish FY17.
Karur Vysya Bank
8,503
141
160
17.3
Lower credit cost will help in strong bottomline growth.
Increasing share of CASA will help in NIM improvement.
High order book execution in EPC segment, rising B2C
KEI Industries
1,741
224
258
15.3
sales and higher exports to boost the revenues and
profitability
Speedier execution and speedier sales, strong revenue
Mahindra Lifespace
2,154
420
522
24.4
visibilty in short-to-long run, attractive valuations
Massive capacity expansion along with rail advantage at
Navkar Corporation
2,758
193
265
37.0
ICD as well CFS augurs well for the company
Strong brands and distribution network would boost
Siyaram Silk Mills
1,937
2,067
2,500
21.0
growth going ahead. Stock currently trades at an
inexpensive valuation.
Market leadership in Hindi news genre and no.
2
viewership ranking in English news genre, exit from the
TV Today Network
1,429
240
344
43.6
radio business, and anticipated growth in ad spends by
corporates to benefit the stock.
After GST, the company is expected to see higher
volumes along with improving product mix. The Gujarat
Maruti
2,34,979
7,779
8,495
9.2
plant will also enable higher operating leverage which
will be margin accretive.
Source: Company, Angel Research,
Market Outlook
August 07, 2017
Key Upcoming Events
Result Calendar
Date
Company
August 07, 2017
Amara Raja Batteries, LMW, Britannia, Tata Steel, Nilkamal
Tata Chemicals, Thermax, Mangalam Cement, Bank of India, GlaxoSmith Con, Jagran Prakashan, Jindal Steel,
August 08, 2017
Vesuvius India, L G Balakrishnan & Bros, GIPCL, Anant Raj, Team Lease Serv.
Source: Bloomberg, Angel Research
Global economic events release calendar
Bloomberg Data
Date
Time
Country
Event Description
Unit
Period
Last Reported
Estimated
Aug 08, 2017
China
Exports YoY%
% Change
Jul
11.30
11.00
Aug 09, 2017
7:00 AMChina
Consumer Price Index (YoY)
% Change
Jul
1.50
1.50
Aug 10, 2017
India
Imports YoY%
% Change
Jul
19.00
6:00 PMUS
Initial Jobless claims
Thousands
Aug 5
240.00
240.00
India
Exports YoY%
% Change
Jul
4.40
6:00 PMUS
Consumer price index (mom)
% Change
Jul
-
0.20
US
Producer Price Index (mom)
% Change
Jul
0.20
Aug 11, 2017
2:00 PMUK
Industrial Production (YoY)
% Change
Jun
(0.20)
(0.10)
5:30 PMIndia
Industrial Production YoY
% Change
Jun
1.70
Aug 14, 2017
7:30 AMChina
Industrial Production (YoY)
% Change
Jul
7.60
7.10
12:00 PMIndia
Monthly Wholesale Prices YoY%
% Change
Jul
0.90
Aug 15, 2017
2:00 PMUK
CPI (YoY)
% Change
Jul
2.60
11:30 AMGermany GDP nsa (YoY)
% Change
2Q P
2.90
Aug 16, 2017
2:30 PMEuro Zone Euro-Zone GDP s.a. (QoQ)
% Change
2Q P
0.60
6:00 PMUS
Housing Starts
Thousands
Jul
1,215.00
1,223.00
Source: Bloomberg, Angel Research
Market Outlook
August 07, 2017
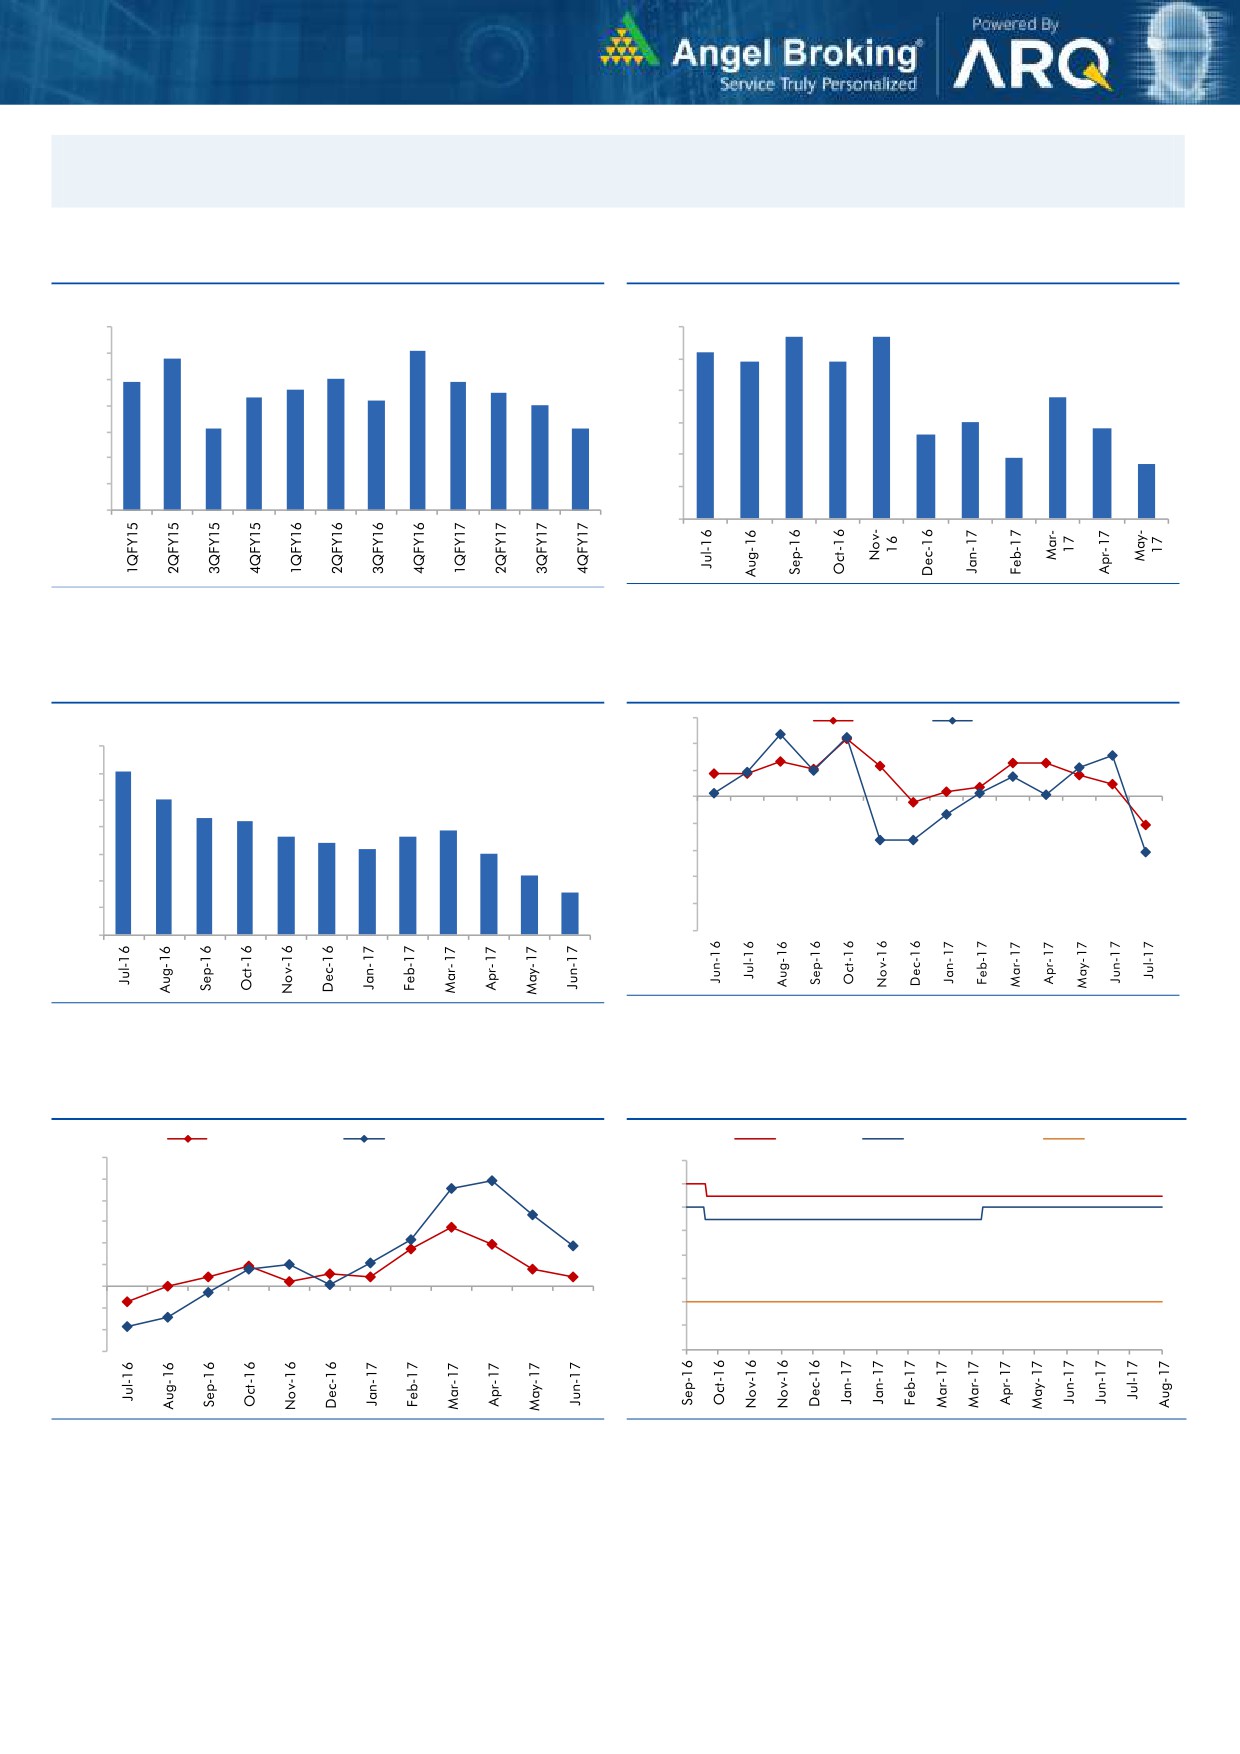
Macro watch
Exhibit 1: Quarterly GDP trends
Exhibit 2: IIP trends
(%)
(%)
5.7
5.7
10.0
6.0
9.1
5.2
8.8
4.9
4.9
9.0
7.9
8.0
7.9
5.0
7.6
7.5
8.0
7.3
7.2
3.8
7.0
4.0
7.0
3.0
6.1
6.1
2.8
3.0
2.6
6.0
1.9
1.7
5.0
2.0
4.0
1.0
3.0
-
Source: CSO, Angel Research
Source: MOSPI, Angel Research
Exhibit 3: Monthly CPI inflation trends
Exhibit 4: Manufacturing and services PMI
56.0
Mfg. PMI
Services PMI
(%)
7.0
54.0
6.1
6.0
52.0
5.1
5.0
50.0
4.3
4.2
3.9
3.6
3.7
4.0
3.4
48.0
3.2
3.0
3.0
46.0
2.2
2.0
1.5
44.0
1.0
42.0
-
40.0
Source: Market, Angel Research; Note: Level above 50 indicates expansion
Source: MOSPI, Angel Research
Exhibit 5: Exports and imports growth trends
Exhibit 6: Key policy rates
(%)
Exports yoy growth
Imports yoy growth
(%)
Repo rate
Reverse Repo rate
CRR
60.0
7.00
50.0
6.50
40.0
6.00
30.0
5.50
20.0
5.00
10.0
4.50
0.0
4.00
(10.0)
(20.0)
3.50
(30.0)
3.00
Source: Bloomberg, Angel Research
Source: RBI, Angel Research
Market Outlook
August 07, 2017
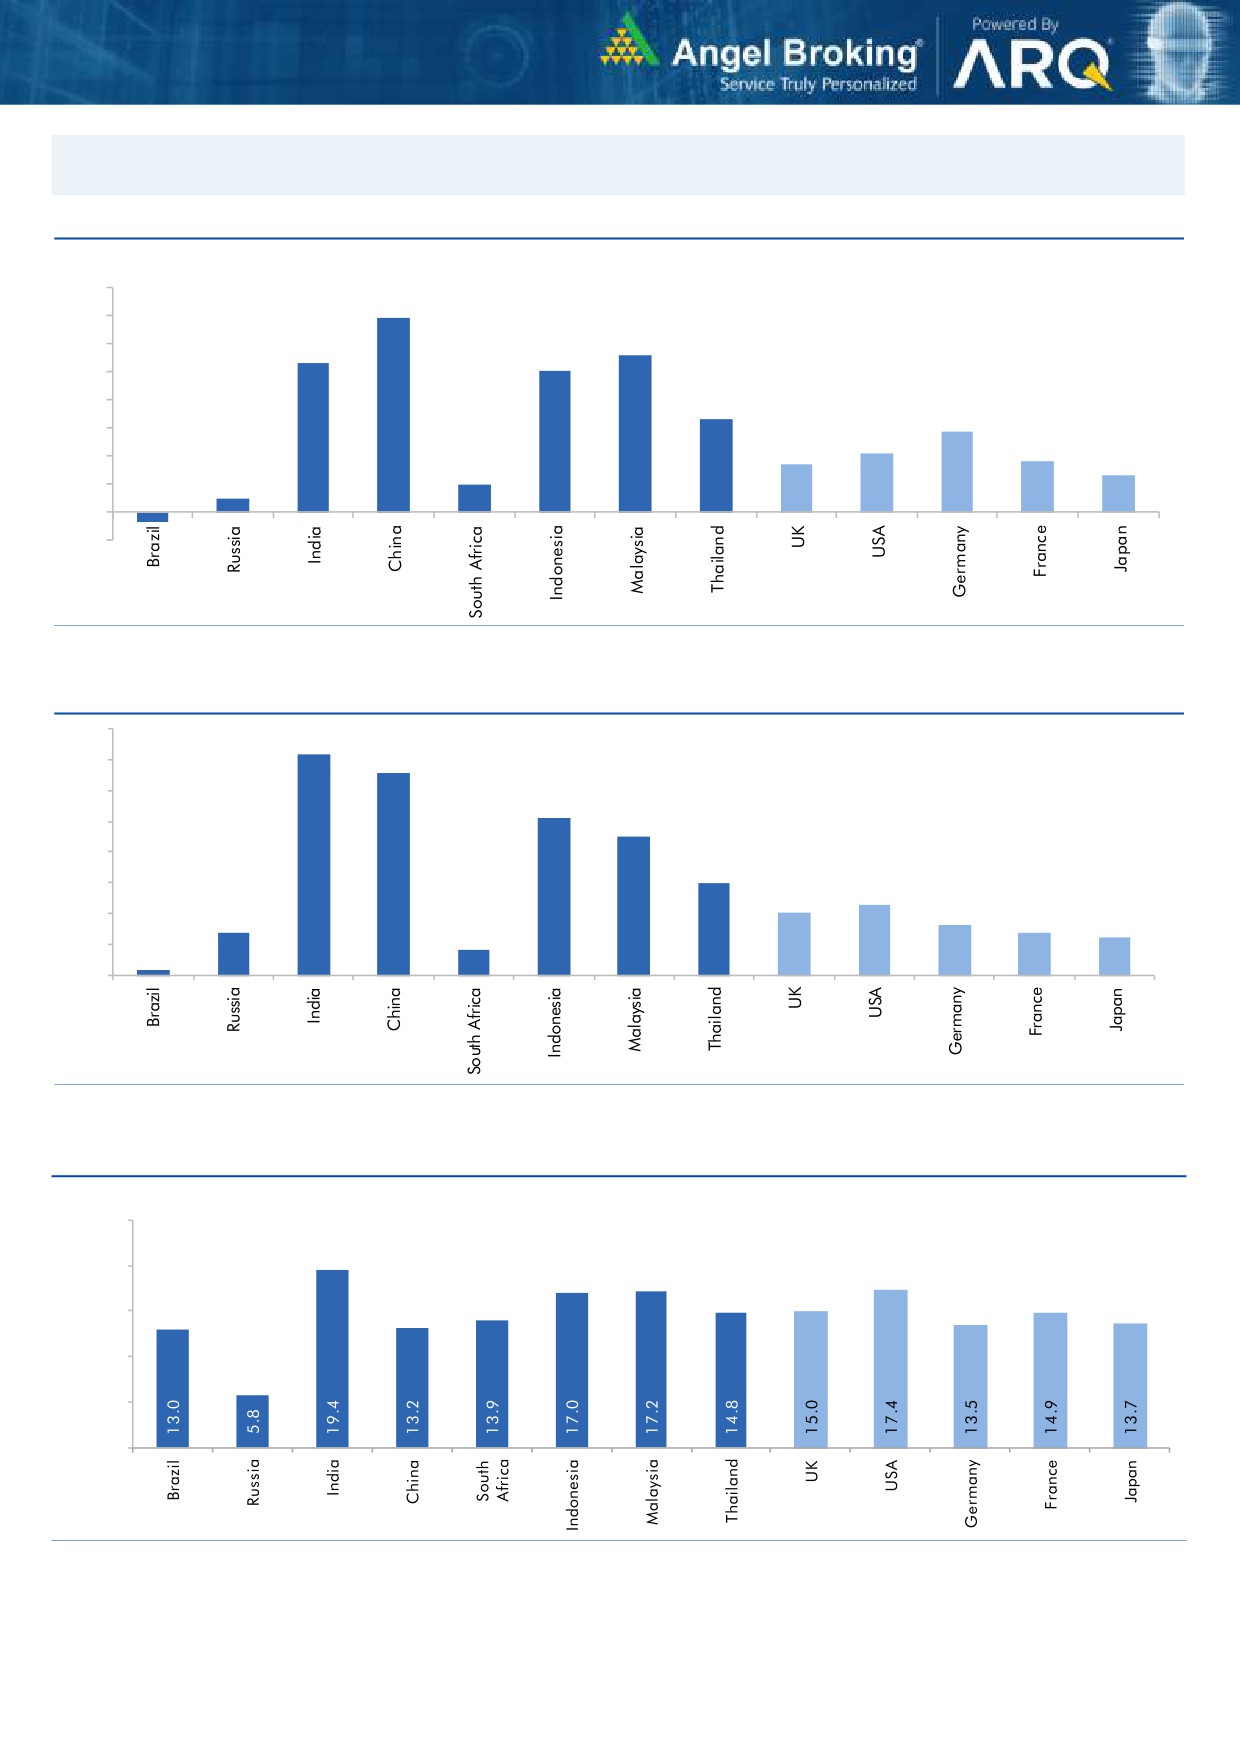
Global watch
Exhibit 1: Latest quarterly GDP Growth (%, yoy) across select developing and developed countries
(%)
8.0
6.9
7.0
5.6
6.0
5.3
5.0
1.0
5.0
4.0
3.3
2.9
3.0
2.1
1.7
1.8
0.5
2.0
1.3
1.0
-
(1.0)
(0.4)
Source: Bloomberg, Angel Research
Exhibit 2: 2016 GDP Growth projection by IMF (%, yoy) across select developing and developed countries
(%)
7.2
7.0
6.6
6.0
5.1
5.0
4.5
4.0
3.0
3.0
2.3
2.0
1.4
1.6
2.0
1.4
1.2
0.2
0.8
1.0
-
Source: IMF, Angel Research
Exhibit 3: One year forward P-E ratio across select developing and developed countries
(x)
25.0
20.0
15.0
10.0
5.0
-
Source: IMF, Angel Research
Market Outlook
August 07, 2017
Exhibit 4: Relative performance of indices across globe
Returns (%)
Country
Name of index
Closing price
1M
3M
1YR
Brazil
Bovespa
66,898
5.9
1.8
19.1
Russia
Micex
1,953
1.7
(2.0)
(0.2)
India
Nifty
10,066
4.4
8.4
16.6
China
Shanghai Composite
3,262
1.7
4.3
8.2
South Africa
Top 40
49,506
7.1
5.3
8.7
Mexico
Mexbol
51,328
2.0
3.7
8.8
Indonesia
LQ45
959
(2.0)
2.3
6.7
Malaysia
KLCI
1,775
0.4
(0.2)
7.0
Thailand
SET 50
1,002
0.3
0.9
3.9
USA
Dow Jones
22,093
2.9
5.4
19.1
UK
FTSE
7,512
2.0
2.9
10.3
Japan
Nikkei
19,952
(0.4)
2.6
21.1
Germany
DAX
12,298
(1.3)
(3.3)
15.5
France
CAC
5,203
0.5
(3.3)
15.6
Source: Bloomberg, Angel Research
Stock Watch
August 07, 2017
Company Name
Reco
CMP
Target
Mkt Cap
Sales ( Čcr )
OPM(%)
EPS (Č)
PER(x)
P/BV(x)
RoE(%)
EV/Sales(x)
(Č)
Price ( Č)
( Č cr )
FY17E FY18E
FY17E
FY18E
FY17E
FY18E
FY17E
FY18E
FY17E
FY18E
FY17E
FY18E
FY17E
FY18E
Agri / Agri Chemical
Rallis
Reduce
244
209
4,743
1,937
2,164
13.3
14.3
9.0
11.0
27.1
22.2
4.7
4.1
18.4
19.8
2.5
2.2
United Phosphorus
Neutral
887
-
45,034
15,176
17,604
18.5
18.5
37.4
44.6
23.7
19.9
4.7
3.9
21.4
21.2
3.1
2.6
Auto & Auto Ancillary
Ashok Leyland
Accumulate
109
116
31,914
20,019
22,789
11.1
11.7
4.3
5.5
25.4
19.9
4.9
4.4
19.4
22.0
1.5
1.3
Bajaj Auto
Neutral
2,874
-
83,155
25,093
27,891
19.5
19.2
143.9
162.5
20.0
17.7
5.6
4.8
30.3
29.4
3.0
2.7
Bharat Forge
Neutral
1,155
-
26,895
7,726
8,713
20.5
21.2
35.3
42.7
32.7
27.1
6.0
5.5
18.9
20.1
3.5
3.1
Eicher Motors
Neutral
31,637
-
86,123
16,583
20,447
17.5
18.0
598.0
745.2
52.9
42.5
18.1
13.8
41.2
38.3
5.0
4.0
Gabriel India
Neutral
168
-
2,415
1,544
1,715
9.0
9.3
5.4
6.3
31.1
26.7
5.9
5.2
18.9
19.5
1.5
1.4
Hero Motocorp
Neutral
3,959
-
79,053
28,120
30,753
15.2
15.6
169.1
189.2
23.4
20.9
8.1
6.8
30.8
28.2
2.6
2.4
Jamna Auto Industries Neutral
264
-
2,107
1,486
1,620
9.8
9.9
15.0
17.2
17.6
15.4
3.9
3.3
21.8
21.3
1.5
1.3
L G Balakrishnan & Bros Neutral
763
-
1,197
1,302
1,432
11.6
11.9
43.7
53.0
17.5
14.4
2.5
2.2
13.8
14.2
1.0
0.9
Mahindra and Mahindra Neutral
1,418
-
88,090
46,534
53,077
11.6
11.7
67.3
78.1
21.1
18.2
3.4
3.0
15.4
15.8
1.9
1.6
Maruti
Accumulate
7,779
8,495
234,979
67,822
83,717
15.2
15.0
243.0
291.5
32.0
26.7
7.3
6.0
22.9
22.4
3.1
2.5
Minda Industries
Neutral
771
-
6,661
2,728
3,042
9.0
9.1
68.2
86.2
11.3
8.9
2.6
2.0
23.8
24.3
2.5
2.2
Motherson Sumi
Neutral
336
-
70,755
45,896
53,687
7.8
8.3
13.0
16.1
25.8
20.9
8.3
6.6
34.7
35.4
1.6
1.4
Rane Brake Lining
Neutral
1,291
-
1,022
511
562
11.3
11.5
28.1
30.9
45.9
41.8
7.0
6.4
15.3
15.0
2.1
2.0
Setco Automotive
Neutral
39
-
519
741
837
13.0
13.0
15.2
17.0
2.6
2.3
0.4
0.4
15.8
16.3
1.1
1.0
Tata Motors
Neutral
435
-
125,629
300,209
338,549
8.9
8.4
42.7
54.3
10.2
8.0
1.6
1.4
15.6
17.2
0.5
0.5
TVS Motor
Neutral
599
-
28,458
13,390
15,948
6.9
7.1
12.8
16.5
46.9
36.2
11.7
9.2
26.3
27.2
2.2
1.8
Amara Raja Batteries
Buy
806
962
13,762
5,339
6,220
15.9
15.3
28.0
32.3
28.8
24.9
5.5
4.6
19.1
18.5
2.6
2.2
Exide Industries
Neutral
216
-
18,343
7,439
8,307
15.0
15.0
8.1
9.3
26.6
23.2
3.7
3.3
14.3
16.7
2.1
1.9
Apollo Tyres
Neutral
262
-
13,354
12,877
14,504
14.3
13.9
21.4
23.0
12.2
11.4
1.9
1.7
16.4
15.2
1.2
1.1
Ceat
Neutral
1,734
-
7,014
7,524
8,624
13.0
12.7
131.1
144.3
13.2
12.0
2.4
2.1
19.8
18.6
1.0
0.9
JK Tyres
Neutral
160
-
3,630
7,455
8,056
15.0
15.0
21.8
24.5
7.3
6.5
1.5
1.3
22.8
21.3
0.6
0.5
Swaraj Engines
Neutral
2,028
-
2,519
660
810
15.2
16.4
54.5
72.8
37.2
27.9
11.6
10.5
31.5
39.2
3.6
2.9
Subros
Neutral
239
-
1,433
1,488
1,681
11.7
11.9
6.4
7.2
37.3
33.3
3.9
3.6
10.8
11.4
1.2
1.0
Indag Rubber
Neutral
188
-
493
286
326
19.8
16.8
11.7
13.3
16.1
14.1
2.7
2.5
17.8
17.1
1.4
1.2
Capital Goods
ACE
Neutral
68
-
672
709
814
4.1
4.6
1.4
2.1
48.5
32.4
2.0
1.9
4.4
6.0
1.1
1.0
BEML
Neutral
1,730
-
7,205
3,451
4,055
6.3
9.2
31.4
57.9
55.1
29.9
3.3
3.0
6.3
10.9
2.2
1.9
Bharat Electronics
Neutral
179
-
39,971
8,137
9,169
16.8
17.2
58.7
62.5
3.1
2.9
0.5
0.4
44.6
46.3
3.9
3.5
Stock Watch
August 07, 2017
Company Name
Reco
CMP
Target
Mkt Cap
Sales ( Čcr )
OPM(%)
EPS (Č)
PER(x)
P/BV(x)
RoE(%)
EV/Sales(x)
(Č)
Price ( Č)
( Č cr )
FY17E
FY18E
FY17E
FY18E
FY17E
FY18E
FY17E
FY18E
FY17E
FY18E
FY17E
FY18E
FY17E
FY18E
Capital Goods
Voltas
Neutral
541
-
17,907
6,511
7,514
7.9
8.7
12.9
16.3
42.0
33.2
7.6
6.6
16.7
18.5
2.5
2.1
BGR Energy
Neutral
143
-
1,030
16,567
33,848
6.0
5.6
7.8
5.9
18.3
24.2
1.0
1.0
4.7
4.2
0.2
0.1
BHEL
Neutral
138
-
33,679
28,797
34,742
-
2.8
2.3
6.9
59.8
19.9
1.0
1.0
1.3
4.8
0.8
0.6
Blue Star
Accumulate
675
760
6,465
4,283
5,077
5.9
7.3
14.9
22.1
45.4
30.5
8.8
7.4
20.4
26.4
1.6
1.3
CG Power and Industrial
Neutral
81
-
5,092
5,777
6,120
5.9
7.0
3.3
4.5
24.6
18.1
1.1
1.0
4.4
5.9
0.8
0.7
Solutions
Greaves Cotton
Neutral
156
-
3,804
1,755
1,881
16.8
16.9
7.8
8.5
20.0
18.3
4.0
3.7
20.6
20.9
1.9
1.7
Inox Wind
Neutral
137
-
3,037
5,605
6,267
15.7
16.4
24.8
30.0
5.5
4.6
1.5
1.1
25.9
24.4
0.6
0.5
KEC International
Neutral
298
-
7,665
9,294
10,186
7.9
8.1
9.9
11.9
30.1
25.1
4.4
3.8
15.6
16.3
1.1
1.0
KEI Industries
Buy
224
258
1,742
2,633
3,001
10.4
10.0
12.7
13.0
17.6
17.2
3.8
3.1
21.4
18.2
0.9
0.8
Thermax
Neutral
902
-
10,747
5,421
5,940
7.3
7.3
25.7
30.2
35.1
29.9
4.2
3.9
12.2
13.1
1.9
1.7
VATech Wabag
Accumulate
623
681
3,401
3,136
3,845
8.9
9.1
26.0
35.9
24.0
17.4
3.0
2.6
13.4
15.9
1.0
0.8
Cement
ACC
Neutral
1,812
-
34,029
11,225
13,172
13.2
16.9
44.5
75.5
40.7
24.0
3.9
3.6
11.2
14.2
3.0
2.6
Ambuja Cements
Neutral
278
-
55,122
9,350
10,979
18.2
22.5
5.8
9.5
47.9
29.2
4.0
3.6
10.2
12.5
5.9
5.0
India Cements
Neutral
198
-
6,103
4,364
4,997
18.5
19.2
7.9
11.3
25.1
17.5
1.8
1.8
8.0
8.5
2.2
1.9
JK Cement
Neutral
1,008
-
7,048
4,398
5,173
15.5
17.5
31.2
55.5
32.3
18.2
3.9
3.4
12.0
15.5
2.2
1.8
J K Lakshmi Cement
Neutral
449
-
5,284
2,913
3,412
14.5
19.5
7.5
22.5
59.9
20.0
3.7
3.1
12.5
18.0
2.4
2.0
Orient Cement
Neutral
155
-
3,176
2,114
2,558
18.5
20.5
8.1
11.3
19.1
13.7
2.8
2.4
9.0
14.0
2.1
1.7
UltraTech Cement
Neutral
4,080
-
112,015
25,768
30,385
21.0
23.5
111.0
160.0
36.8
25.5
4.7
4.1
13.5
15.8
4.4
3.7
Construction
ITNL
Neutral
89
-
2,928
8,946
10,017
31.0
31.6
8.1
9.1
11.0
9.8
0.4
0.4
4.2
5.0
3.7
3.4
KNR Constructions
Neutral
208
-
2,927
1,385
1,673
14.7
14.0
41.2
48.5
5.1
4.3
0.9
0.8
14.9
15.2
2.2
1.8
Larsen & Toubro
Buy
1,177
1,700
164,773
111,017
124,908
11.0
11.0
61.1
66.7
19.3
17.6
2.3
2.1
13.1
12.9
2.5
2.3
Gujarat Pipavav Port
Neutral
140
-
6,780
705
788
52.2
51.7
5.0
5.6
28.1
25.0
2.8
2.5
11.2
11.2
9.3
7.8
Nagarjuna Const.
Neutral
87
-
4,842
8,842
9,775
9.1
8.8
5.3
6.4
16.4
13.6
1.3
1.2
8.2
9.1
0.7
0.6
PNC Infratech
Neutral
141
-
3,610
2,350
2,904
13.1
13.2
9.0
8.8
15.6
16.0
0.6
0.5
15.9
13.9
1.7
1.3
Simplex Infra
Neutral
455
-
2,249
6,829
7,954
10.5
10.5
31.4
37.4
14.5
12.2
1.5
1.4
9.9
13.4
0.8
0.6
Power Mech Projects
Neutral
585
-
861
1,801
2,219
12.7
14.6
72.1
113.9
8.1
5.1
1.5
1.3
16.8
11.9
0.5
0.4
Sadbhav Engineering
Neutral
288
-
4,941
3,598
4,140
10.3
10.6
9.0
11.9
32.0
24.2
3.4
2.9
9.9
11.9
1.7
1.4
NBCC
Neutral
217
-
19,503
7,428
9,549
7.9
8.6
8.2
11.0
26.4
19.7
1.3
1.0
28.2
28.7
2.3
1.8
MEP Infra
Neutral
123
-
1,996
1,877
1,943
30.6
29.8
3.0
4.2
40.9
29.2
19.8
13.3
0.6
0.6
2.4
2.3
Stock Watch
August 07, 2017
Company Name
Reco
CMP
Target
Mkt Cap
Sales ( Čcr )
OPM(%)
EPS (Č)
PER(x)
P/BV(x)
RoE(%)
EV/Sales(x)
(Č)
Price ( Č)
( Č cr )
FY17E
FY18E
FY17E
FY18E
FY17E
FY18E
FY17E
FY18E
FY17E
FY18E
FY17E
FY18E
FY17E
FY18E
Construction
SIPL
Neutral
103
-
3,623
1,036
1,252
65.5
66.2
(8.4)
(5.6)
3.9
4.4
(22.8)
(15.9)
11.7
9.7
Engineers India
Neutral
160
-
10,752
1,725
1,935
16.0
19.1
11.4
13.9
14.0
11.5
1.9
1.9
13.4
15.3
5.2
4.6
Financials
Axis Bank
Accumulate
508
580
121,885
46,932
53,575
3.5
3.4
32.4
44.6
15.7
11.4
2.0
1.8
13.6
16.5
-
-
Bank of Baroda
Neutral
159
-
36,625
19,980
23,178
1.8
1.8
11.5
17.3
13.8
9.2
1.6
1.3
8.3
10.1
-
-
Canara Bank
Neutral
351
-
20,992
15,225
16,836
1.8
1.8
14.5
28.0
24.2
12.6
1.7
1.4
5.8
8.5
-
-
Can Fin Homes
Neutral
2,979
-
7,930
420
526
3.5
3.5
86.5
107.8
34.4
27.6
7.4
6.1
23.6
24.1
-
-
Cholamandalam Inv. &
Neutral
1,180
-
18,449
2,012
2,317
6.3
6.3
42.7
53.6
27.6
22.0
4.4
3.8
16.9
18.3
-
-
Fin. Co.
Dewan Housing Finance Buy
457
550
14,320
2,225
2,688
2.9
2.9
29.7
34.6
15.4
13.2
2.5
1.6
16.1
14.8
-
-
Equitas Holdings
Buy
168
235
5,679
939
1,281
11.7
11.5
5.8
8.2
28.9
20.5
2.5
2.2
10.9
11.5
-
-
Federal Bank
Buy
114
140
22,150
8,259
8,995
3.0
3.0
4.3
5.6
26.5
20.4
2.2
2.1
8.5
10.1
-
-
HDFC
Neutral
1,733
-
276,033
11,475
13,450
3.4
3.4
45.3
52.5
38.3
33.0
7.4
6.5
20.2
20.5
-
-
HDFC Bank
Neutral
1,791
-
461,272
46,097
55,433
4.5
4.5
58.4
68.0
30.7
26.3
5.4
4.5
18.8
18.6
-
-
ICICI Bank
Accumulate
296
335
189,933
42,800
44,686
3.1
3.3
18.0
21.9
16.5
13.5
2.2
2.1
11.1
12.3
-
-
Karur Vysya Bank
Accumulate
141
160
8,503
5,640
6,030
3.3
3.2
8.9
10.0
15.8
14.1
1.7
1.5
11.2
11.4
-
-
Lakshmi Vilas Bank
Neutral
177
-
3,399
3,339
3,799
2.7
2.8
11.0
14.0
16.1
12.7
1.7
1.5
11.2
12.7
-
-
LIC Housing Finance
Neutral
684
-
34,539
3,712
4,293
2.6
2.5
39.0
46.0
17.6
14.9
3.3
2.8
19.9
20.1
-
-
Punjab Natl.Bank
Neutral
151
-
32,132
23,532
23,595
2.3
2.4
6.8
12.6
22.2
12.0
3.4
2.4
3.3
6.5
-
-
RBL Bank
Neutral
515
-
19,536
1,783
2,309
2.6
2.6
12.7
16.4
40.6
31.4
4.4
4.0
12.8
13.3
-
-
Repco Home Finance
Accumulate
767
825
4,801
388
457
4.5
4.2
30.0
38.0
25.6
20.2
4.3
3.6
18.0
19.2
-
-
South Ind.Bank
Neutral
29
-
5,275
6,435
7,578
2.5
2.5
2.7
3.1
10.8
9.4
1.4
1.2
10.1
11.2
-
-
St Bk of India
Accumulate
305
335
263,666
88,650
98,335
2.6
2.6
13.5
18.8
22.6
16.3
2.2
1.9
7.0
8.5
-
-
Union Bank
Neutral
145
-
9,978
13,450
14,925
2.3
2.3
25.5
34.5
5.7
4.2
0.8
0.7
7.5
10.2
-
-
Yes Bank
Neutral
1,809
-
82,793
8,978
11,281
3.3
3.4
74.0
90.0
24.5
20.1
4.6
3.9
17.0
17.2
-
-
FMCG
Akzo Nobel India
Neutral
1,796
-
8,614
2,955
3,309
13.3
13.7
57.2
69.3
31.4
25.9
10.3
8.6
32.7
33.3
2.7
2.4
Asian Paints
Neutral
1,157
-
110,960
17,128
18,978
16.8
16.4
19.1
20.7
60.6
55.9
21.1
19.9
34.8
35.5
6.4
5.8
Britannia
Neutral
3,913
-
46,984
9,594
11,011
14.6
14.9
80.3
94.0
48.7
41.6
20.0
15.5
41.2
-
4.8
4.1
Colgate
Neutral
1,074
-
29,210
4,605
5,149
23.4
23.4
23.8
26.9
45.1
39.9
25.0
19.5
64.8
66.8
6.3
5.6
Dabur India
Neutral
308
-
54,184
8,315
9,405
19.8
20.7
8.1
9.2
38.0
33.4
10.6
8.8
31.6
31.0
6.2
5.4
GlaxoSmith Con*
Neutral
5,447
-
22,908
4,350
4,823
21.2
21.4
179.2
196.5
30.4
27.7
8.1
6.8
27.1
26.8
4.7
4.1
Stock Watch
August 07, 2017
Company Name
Reco
CMP
Target
Mkt Cap
Sales ( Čcr )
OPM(%)
EPS (Č)
PER(x)
P/BV(x)
RoE(%)
EV/Sales(x)
(Č)
Price ( Č)
( Č cr )
FY17E FY18E
FY17E
FY18E
FY17E
FY18E
FY17E
FY18E
FY17E
FY18E
FY17E
FY18E
FY17E
FY18E
FMCG
Godrej Consumer
Neutral
961
-
65,433
10,235
11,428
18.4
18.6
41.1
44.2
23.4
21.7
5.2
4.4
24.9
24.8
6.5
5.7
HUL
Neutral
1,192
-
257,982
35,252
38,495
17.8
17.8
20.7
22.4
57.7
53.2
55.2
47.3
95.6
88.9
7.2
6.5
ITC
Neutral
281
-
341,443
40,059
44,439
38.3
39.2
9.0
10.1
31.3
27.7
8.7
7.6
27.8
27.5
8.0
7.2
Marico
Neutral
325
-
41,953
6,430
7,349
18.8
19.5
6.4
7.7
50.8
42.2
15.3
12.9
33.2
32.5
6.3
5.5
Nestle*
Neutral
6,697
-
64,568
10,073
11,807
20.7
21.5
124.8
154.2
53.7
43.4
22.0
19.8
34.8
36.7
6.2
5.3
Tata Global
Neutral
166
-
10,505
8,675
9,088
9.8
9.8
7.4
8.2
22.5
20.3
1.8
1.7
7.9
8.1
1.1
1.1
Procter & Gamble
Neutral
8,195
-
26,602
2,939
3,342
23.2
23.0
146.2
163.7
56.1
50.1
14.2
11.8
25.3
23.5
8.6
7.5
Hygiene
IT
HCL Tech^
Accumulate
891
1,014
127,095
46,723
52,342
22.1
20.9
60.0
62.8
14.8
14.2
3.8
3.2
25.3
22.4
2.5
2.1
Infosys
Buy
985
1,179
226,329
68,484
73,963
26.0
26.0
63.0
64.0
15.6
15.4
3.3
3.0
20.8
19.7
3.0
2.6
TCS
Accumulate
2,523
2,651
497,090
117,966
127,403
27.5
27.6
134.3
144.5
18.8
17.5
5.6
5.2
29.8
29.7
3.9
3.6
Tech Mahindra
Buy
409
533
39,857
29,141
31,051
14.4
15.0
32.3
35.6
12.7
11.5
2.2
2.0
17.1
17.0
1.2
1.1
Wipro
Neutral
289
-
140,785
55,421
58,536
20.3
20.3
35.1
36.5
8.2
7.9
1.4
1.2
19.2
14.6
2.0
1.7
Media
D B Corp
Neutral
379
-
6,978
2,297
2,590
27.4
28.2
21.0
23.4
18.1
16.2
4.2
3.7
23.7
23.1
2.8
2.4
HT Media
Neutral
87
-
2,016
2,693
2,991
12.6
12.9
7.9
9.0
11.0
9.6
0.9
0.9
7.8
8.3
0.3
0.2
Jagran Prakashan
Buy
177
225
5,788
2,283
2,555
28.0
28.0
10.6
12.3
16.7
14.5
3.6
3.1
21.4
21.4
2.5
2.2
Sun TV Network
Neutral
786
-
30,989
2,850
3,265
70.1
71.0
26.2
30.4
30.0
25.9
7.7
6.8
24.3
25.6
10.5
9.0
Hindustan Media
Neutral
270
-
1,981
1,016
1,138
24.3
25.2
27.3
30.1
9.9
9.0
1.9
1.7
16.2
15.8
1.3
1.1
Ventures
TV Today Network
Buy
240
344
1,429
608
667
21.5
22.3
15.7
19.2
15.3
12.5
2.3
2.0
16.1
16.0
1.9
1.7
Music Broadcast Limited Buy
353
434
2,014
271
317
91.0
109.0
6.0
10.0
58.8
35.3
3.7
3.3
6.5
9.3
7.0
5.8
Metals & Mining
Coal India
Neutral
249
-
154,689
84,638
94,297
21.4
22.3
24.5
27.1
10.2
9.2
4.2
4.0
42.6
46.0
1.3
1.2
Hind. Zinc
Neutral
286
-
120,717
14,252
18,465
55.9
48.3
15.8
21.5
18.1
13.3
3.0
2.6
17.0
20.7
8.5
6.5
Hindalco
Neutral
225
-
50,489
107,899
112,095
7.4
8.2
9.2
13.0
24.5
17.3
1.2
1.1
4.8
6.6
1.0
0.9
JSW Steel
Neutral
228
-
55,197
53,201
58,779
16.1
16.2
130.6
153.7
1.8
1.5
0.2
0.2
14.0
14.4
1.8
1.6
NMDC
Neutral
125
-
39,533
6,643
7,284
44.4
47.7
7.1
7.7
17.6
16.2
1.5
1.5
8.8
9.2
3.7
3.3
SAIL
Neutral
62
-
25,421
47,528
53,738
(0.7)
2.1
(1.9)
2.6
23.7
0.7
0.6
(1.6)
3.9
1.4
1.3
Vedanta
Neutral
289
-
107,371
71,744
81,944
19.2
21.7
13.4
20.1
21.6
14.4
1.8
1.7
8.4
11.3
1.9
1.5
Tata Steel
Neutral
576
-
55,893
121,374
121,856
7.2
8.4
18.6
34.3
30.9
16.8
1.9
1.8
6.1
10.1
1.1
1.1
Oil & Gas
GAIL
Neutral
379
-
64,075
56,220
65,198
9.3
10.1
27.1
33.3
14.0
11.4
1.3
1.2
9.3
10.7
1.3
1.1
ONGC
Neutral
167
-
213,738
137,222
152,563
15.0
21.8
19.5
24.1
8.5
6.9
0.7
0.7
8.5
10.1
1.8
1.6
Stock Watch
August 07, 2017
Company Name
Reco
CMP
Target
Mkt Cap
Sales ( Čcr )
OPM(%)
EPS (Č)
PER(x)
P/BV(x)
RoE(%)
EV/Sales(x)
(Č)
Price ( Č)
( Č cr )
FY17E FY18E
FY17E
FY18E
FY17E
FY18E
FY17E
FY18E
FY17E
FY18E
FY17E
FY18E
FY17E
FY18E
Oil & Gas
Indian Oil Corp
Neutral
419
-
203,438
373,359
428,656
5.9
5.5
54.0
59.3
7.8
7.1
1.2
1.1
16.0
15.6
0.7
0.6
Reliance Industries
Neutral
1,623
-
527,594
301,963
358,039
12.1
12.6
87.7
101.7
18.5
16.0
1.9
1.7
10.7
11.3
2.2
1.9
Pharmaceuticals
Alembic Pharma
Accumulate
531
600
10,003
3,101
3,966
19.7
20.5
21.4
25.5
24.8
20.8
5.3
4.3
23.0
22.8
3.2
2.4
Alkem Laboratories Ltd
Buy
1,829
2,161
21,866
5,853
6,901
17.1
18.4
74.6
85.0
24.5
21.5
5.2
4.4
21.1
20.2
3.7
3.2
Aurobindo Pharma
Accumulate
725
823
42,488
14,845
17,086
21.5
22.1
39.4
44.7
18.4
16.2
4.5
3.6
27.6
24.7
3.0
2.6
Aventis*
Neutral
4,247
-
9,780
2,206
2,508
16.6
16.8
128.9
139.9
33.0
30.4
5.6
4.4
21.6
23.5
4.2
3.5
Cadila Healthcare
Sell
532
450
54,422
9,220
11,584
18.4
20.3
14.5
18.7
36.7
28.4
7.8
6.3
23.5
24.6
6.2
4.8
Cipla
Sell
567
461
45,629
14,281
16,619
15.4
16.2
12.5
19.7
45.4
28.8
3.6
3.3
8.4
12.0
3.4
2.9
Dr Reddy's
Neutral
2,244
-
37,197
14,081
15,937
16.1
18.6
72.6
105.9
30.9
21.2
3.0
2.7
9.6
13.6
2.9
2.5
Dishman Pharma
Sell
143
1,718
1,890
22.7
22.8
9.5
11.3
10.1
10.9
3.3
2.9
GSK Pharma*
Neutral
2,401
-
20,334
2,927
3,290
11.8
16.2
34.4
49.6
69.8
48.4
10.1
10.5
13.9
21.3
6.7
6.1
Indoco Remedies
Sell
199
153
1,836
1,067
1,154
12.1
14.9
8.4
11.3
23.7
17.6
2.8
2.5
12.6
15.0
1.9
1.8
Ipca labs
Buy
461
620
5,822
3,211
3,593
13.9
14.5
15.4
19.4
30.0
23.8
2.4
2.2
8.2
9.5
1.9
1.7
Lupin
Buy
993
1,526
44,836
17,120
18,657
24.1
24.1
56.9
61.1
17.4
16.2
3.3
2.8
20.7
18.6
2.9
2.3
Natco Pharma
Accumulate
950
1,060
16,551
2,065
1,988
33.1
33.7
27.9
25.7
34.0
36.9
9.9
8.5
29.2
22.9
8.1
8.2
Sun Pharma
Buy
507
712
121,558
30,264
32,899
29.0
26.9
32.7
31.6
15.5
16.0
3.3
2.8
22.2
18.7
3.7
3.3
Power
Tata Power
Neutral
80
-
21,706
36,916
39,557
17.4
27.1
5.1
6.3
15.7
12.7
1.4
1.3
9.0
10.3
1.6
1.4
NTPC
Neutral
177
-
146,151
86,605
95,545
17.5
20.8
11.8
13.4
15.0
13.2
1.5
1.4
10.5
11.1
3.0
3.0
Power Grid
Neutral
225
-
117,632
25,315
29,193
88.2
88.7
14.2
17.2
15.9
13.1
2.4
2.1
15.2
16.1
9.3
8.3
Real Estate
Prestige Estate
Neutral
272
-
10,185
4,707
5,105
25.2
26.0
10.3
13.0
26.4
20.9
2.1
2.0
10.3
10.2
3.3
3.0
MLIFE
Buy
420
522
2,154
1,152
1,300
22.7
24.6
29.9
35.8
14.0
11.7
1.0
1.0
7.6
8.6
2.6
2.2
Telecom
Bharti Airtel
Neutral
421
-
168,271
105,086
114,808
34.5
34.7
12.2
16.4
34.5
25.7
2.3
2.2
6.8
8.4
2.5
2.2
Idea Cellular
Neutral
93
-
33,416
40,133
43,731
37.2
37.1
6.4
6.5
14.5
14.3
1.2
1.1
8.2
7.6
1.9
1.6
zOthers
Abbott India
Neutral
4,387
-
9,323
3,153
3,583
14.1
14.4
152.2
182.7
28.8
24.0
141.5
120.9
25.6
26.1
2.7
2.3
Asian Granito
Accumulate
424
480
1,275
1,066
1,169
11.6
12.5
13.0
16.0
32.6
26.5
3.2
2.8
9.5
10.7
1.5
1.3
Bajaj Electricals
Buy
325
395
3,296
4,801
5,351
5.7
6.2
10.4
13.7
31.2
23.8
3.9
3.4
12.4
14.5
0.7
0.6
Banco Products (India)
Neutral
216
-
1,544
1,353
1,471
12.3
12.4
14.5
16.3
14.9
13.3
20.6
18.5
14.5
14.6
1.1
116.2
Coffee Day Enterprises
Neutral
245
-
5,048
2,964
3,260
20.5
21.2
4.7
8.0
-
30.6
2.8
2.6
5.5
8.5
2.1
1.9
Ltd
Competent Automobiles Neutral
215
-
138
1,137
1,256
3.1
2.7
28.0
23.6
7.7
9.1
41.4
37.4
14.3
11.5
0.1
0.1
Stock Watch
August 07, 2017
Company Name
Reco
CMP
Target
Mkt Cap
Sales ( Čcr )
OPM(%)
EPS (Č)
PER(x)
P/BV(x)
RoE(%)
EV/Sales(x)
(Č)
Price ( Č)
( Č cr )
FY17E
FY18E
FY17E
FY18E
FY17E
FY18E
FY17E
FY18E
FY17E
FY18E
FY17E
FY18E
FY17E
FY18E
zOthers
Elecon Engineering
Neutral
54
-
602
1,482
1,660
13.7
14.5
3.9
5.8
13.8
9.3
3.2
3.0
7.8
10.9
0.7
0.6
Finolex Cables
Neutral
482
-
7,378
2,883
3,115
12.0
12.1
14.2
18.6
34.0
25.9
18.1
15.8
15.8
14.6
2.3
2.0
Garware Wall Ropes
Neutral
888
-
1,942
863
928
15.1
15.2
36.4
39.4
24.4
22.5
4.4
3.8
17.5
15.9
2.2
2.0
Goodyear India*
Neutral
882
-
2,034
1,598
1,704
10.4
10.2
49.4
52.6
17.9
16.8
82.4
72.3
18.2
17.0
1.0
136.6
Hitachi
Neutral
2,034
-
5,530
2,081
2,433
8.8
8.9
33.4
39.9
60.9
51.0
49.1
40.9
22.1
21.4
2.7
2.2
HSIL
Neutral
367
-
2,655
2,384
2,515
15.8
16.3
15.3
19.4
24.0
18.9
23.9
20.5
7.8
9.3
1.3
1.2
Interglobe Aviation
Neutral
1,276
-
46,151
21,122
26,005
14.5
27.6
110.7
132.1
11.5
9.7
69.0
49.3
168.5
201.1
2.2
1.7
Jyothy Laboratories
Neutral
383
-
6,960
1,440
2,052
11.5
13.0
8.5
10.0
45.1
38.3
10.9
10.1
18.6
19.3
5.1
3.6
Kirloskar Engines India
Neutral
400
-
5,789
2,554
2,800
9.9
10.0
10.5
12.1
38.1
33.1
16.0
15.1
10.7
11.7
1.9
1.7
Ltd
Linc Pen & Plastics
Neutral
262
-
388
382
420
9.3
9.5
13.5
15.7
19.5
16.7
3.3
2.9
17.1
17.3
1.1
1.0
M M Forgings
Neutral
612
-
738
546
608
20.4
20.7
41.3
48.7
14.8
12.6
83.8
74.2
16.6
17.0
1.2
1.1
Manpasand Bever.
Neutral
778
-
4,453
836
1,087
19.6
19.4
16.9
23.8
46.1
32.7
5.5
4.8
12.0
14.8
5.1
3.8
Mirza International
Neutral
163
-
1,956
963
1,069
17.2
18.0
6.1
7.5
26.5
21.7
4.1
3.4
15.0
15.7
2.2
2.0
MT Educare
Neutral
66
-
261
366
417
17.7
18.2
9.4
10.8
7.0
6.1
1.6
1.4
22.2
22.3
0.6
0.5
Narayana Hrudaya
Neutral
300
-
6,128
1,873
2,166
11.5
11.7
2.6
4.0
113.4
75.6
7.0
6.3
6.1
8.3
3.4
2.9
Navkar Corporation
Buy
193
265
2,758
347
371
43.2
37.3
6.7
6.0
29.0
32.3
2.0
1.8
6.2
10.6
9.1
8.5
Navneet Education
Neutral
159
-
3,703
1,062
1,147
24.0
24.0
6.1
6.6
26.0
23.9
5.4
4.7
20.6
19.8
3.6
3.3
Nilkamal
Neutral
1,786
-
2,665
1,995
2,165
10.7
10.4
69.8
80.6
25.6
22.2
102.0
88.6
16.6
16.5
1.3
1.2
Page Industries
Neutral
16,368
-
18,256
2,450
3,124
20.1
17.6
299.0
310.0
54.7
52.8
364.5
278.3
47.1
87.5
7.5
5.9
Parag Milk Foods
Neutral
254
-
2,132
1,919
2,231
9.3
9.6
9.5
12.9
26.8
19.6
4.2
3.4
15.5
17.5
1.3
1.1
Quick Heal
Neutral
209
-
1,469
408
495
27.3
27.0
7.7
8.8
27.0
23.8
2.5
2.5
9.3
10.6
2.7
2.3
Radico Khaitan
Neutral
146
-
1,937
1,667
1,824
13.0
13.2
6.7
8.2
21.9
17.8
2.0
1.8
9.0
10.2
1.6
1.4
Relaxo Footwears
Neutral
454
-
5,454
2,085
2,469
9.2
8.2
7.6
8.0
60.1
57.1
23.3
19.9
17.9
18.8
2.7
2.3
S H Kelkar & Co.
Neutral
265
-
3,831
1,036
1,160
15.1
15.0
6.1
7.2
43.4
36.9
4.6
4.3
10.7
11.5
3.6
3.1
Siyaram Silk Mills
Buy
2,067
2,500
1,937
1,574
1,769
12.5
12.7
97.1
113.1
21.3
18.3
3.3
2.8
15.4
15.5
1.4
1.3
Styrolution ABS India*
Neutral
1,022
-
1,798
1,440
1,537
9.2
9.0
40.6
42.6
25.2
24.0
64.3
58.4
12.3
11.6
1.2
1.1
Surya Roshni
Neutral
285
-
1,249
3,342
3,625
7.8
7.5
17.3
19.8
16.5
14.4
31.3
25.1
10.5
10.8
0.6
0.6
Team Lease Serv.
Neutral
1,412
-
2,413
3,229
4,001
1.5
1.8
22.8
32.8
62.0
43.0
6.6
5.8
10.7
13.4
0.6
0.5
The Byke Hospitality
Neutral
199
-
797
287
384
20.5
20.5
7.6
10.7
26.1
18.6
5.5
4.4
20.7
23.5
2.8
2.1
Stock Watch
August 07, 2017
Company Name
Reco
CMP
Target Mkt Cap
Sales ( Čcr )
OPM(%)
EPS (Č)
PER(x)
P/BV(x)
RoE(%)
EV/Sales(x)
(Č)
Price ( Č)
( Č cr )
FY17E FY18E FY17E FY18E FY17E FY18E FY17E FY18E FY17E FY18E FY17E FY18E FY17E FY18E
zOthers
Transport Corporation of
Neutral
298
-
2,283
2,671
2,911
8.5
8.8
13.9
15.7
21.5
19.1
2.9
2.6
13.7
13.8
1.0
0.9
India
TVS Srichakra
Neutral
3,605
-
2,760
2,304
2,614
13.7
13.8
231.1
266.6
15.6
13.5
405.0
318.9
33.9
29.3
1.2
1.0
UFO Moviez
Neutral
368
-
1,015
619
685
33.2
33.4
30.0
34.9
12.3
10.5
1.7
1.5
13.8
13.9
1.3
1.0
Visaka Industries
Neutral
488
-
775
1,051
1,138
10.3
10.4
21.0
23.1
23.2
21.1
62.6
58.6
9.0
9.2
1.0
0.9
VRL Logistics
Neutral
343
-
3,134
1,902
2,119
16.7
16.6
14.6
16.8
23.6
20.4
5.2
4.5
21.9
22.2
1.8
1.6
VIP Industries
Accumulate
194
218
2,746
1,270
1,450
10.4
10.4
5.6
6.5
34.7
29.9
7.2
6.3
20.7
21.1
2.2
1.9
Navin Fluorine
Neutral
738
-
3,634
789
945
21.1
22.4
24.0
28.7
30.7
25.7
4.9
4.3
17.8
18.5
4.5
3.7
Source: Company, Angel Research; Note: *December year end; #September year end; &October year end; Price as on August 04, 2017
Market Outlook
August 07, 2017
Research Team Tel: 022 - 39357800
DISCLAIMER
Angel Broking Private Limited (hereinafter referred to as “Angel”) is a registered Member of National Stock Exchange of India
Limited,Bombay Stock Exchange Limited and Metropolitan Stock Exchange Limited. It is also registered as a Depository Participant with
CDSL and Portfolio Manager with SEBI. It also has registration with AMFI as a Mutual Fund Distributor. Angel Broking Private Limited is a
registered entity with SEBI for Research Analyst in terms of SEBI (Research Analyst) Regulations, 2014 vide registration number
INH000000164. Angel or its associates has not been debarred/ suspended by SEBI or any other regulatory authority for accessing
/dealing in securities Market. Angel or its associates/analyst has not received any compensation / managed or
co-managed public offering of securities of the company covered by Analyst during the past twelve months.
This document is solely for the personal information of the recipient, and must not be singularly used as the basis of any investment
decision. Nothing in this document should be construed as investment or financial advice. Each recipient of this document should make
such investigations as they deem necessary to arrive at an independent evaluation of an investment in the securities of the companies
referred to in this document (including the merits and risks involved), and should consult their own advisors to determine the merits and
risks of such an investment.
Reports based on technical and derivative analysis center on studying charts of a stock's price movement, outstanding positions and
trading volume, as opposed to focusing on a company's fundamentals and, as such, may not match with a report on a company's
fundamentals. Investors are advised to refer the Fundamental and Technical Research Reports available on our website to evaluate the
contrary view, if any.
The information in this document has been printed on the basis of publicly available information, internal data and other reliable
sources believed to be true, but we do not represent that it is accurate or complete and it should not be relied on as such, as this
document is for general guidance only. Angel Broking Pvt. Limited or any of its affiliates/ group companies shall not be in any way
responsible for any loss or damage that may arise to any person from any inadvertent error in the information contained in this report.
Angel Broking Pvt. Limited has not independently verified all the information contained within this document. Accordingly, we cannot
testify, nor make any representation or warranty, express or implied, to the accuracy, contents or data contained within this document.
While Angel Broking Pvt. Limited endeavors to update on a reasonable basis the information discussed in this material, there may be
regulatory, compliance, or other reasons that prevent us from doing so.
This document is being supplied to you solely for your information, and its contents, information or data may not be reproduced,
redistributed or passed on, directly or indirectly.
Neither Angel Broking Pvt. Limited, nor its directors, employees or affiliates shall be liable for any loss or damage that may arise from
or in connection with the use of this information.